The S&P 500 (SPY) is up nearly 50% from the bear market lows. That is a sign the easy money has been made. The next likely catalyst for stocks will probably be the first Fed rate cut…but maybe that is really the final push before a long overdue sell off? Tune in to discover what investment veteran Steve Reitmeister has to say about the market outlook along with his trading plan and top picks to stay ahead of the pack. Read on below for more.
It is clear that the Fed decision to lower rates is the main catalyst everyone is waiting for. The next chance that could happen is on Wednesday May 1st.
Since the Fed is “data dependent” (as they repeat like a skipped record) then we are best served focusing on the calendar of upcoming data…and what that tells us about the rate cut decision and market outlook. Read on below for the full story…
Market Commentary
The backdrop is simple. The Fed seems to be successfully guiding the economy towards a soft landing while at the same time easing inflation back towards the 2% target.
As Powell detailed at the last meeting, the Fed can indeed start lowering rates before they arrive at the 2% target because rates would still be restrictive after the first cut. Secondly, there are delayed effects of raised rates and if you waited til you got to precisely 2% you may actually risk doing unnecessary damage to jobs market (which is the other half of their dual mandate of maintaining steady prices and maximum employment).
Right now, virtually no one expects that rate cut to take place at the May 1st meeting as the last round of inflation data was a tad too hot. Thus, just one more serving of monthly inflation data in April would not be enough to get these academics to vote confidently in a rate cut.
Instead, the focus is on whether June 12th will be the starting line for rate cuts. Presently the CME calculates that as a 65% probability. But again, that is data dependent on the roll call of reports taking place in coming weeks…and what Powell shares with the market on his May 1st press conference.
Here are the key economic reports along with some notes to put them into perspective:
3/28 Core PCE- This is the Fed’s preferred measure of inflation which has been at 2.0% the past two quarters. Even better is the non-core reading for Q4 of 1.8% which is down considerably from the 2.6% showing in Q3. This data should go a long way towards a June rate cut.
4/5 Government Employment Situation: What will be even more important than the number of jobs added will be the reading on Wage Inflation. That was too hot last month at +4.3% year over year. Need to keep seeing this sticky form of inflation become unstuck at this high level. The month over month reading will be helpful in appreciating the pace of decline. Anything over 0.2% monthly increase would point to unwanted inflationary pressures from wages.
4/10 Consumer Price Index (CPI): This has been nicely on the decline over the past year, but last month was a tad higher than expected at 3.8% core inflation with 0.4% monthly increase. This needs to start moving under 3% in coming months to improve odds of a cut on the way.
4/10 FOMC Minutes: Its hard to imagine more details emerging than the voluminous comments that Powell made at the March 20th press conference. Yet you can imagine that investors will pick over every word to find any clue that would point to a likely starting line for rate cuts.
4/11 Producer Price Index (PPI): The least followed of the 3 main inflation reports, but what many economists appreciate as the leading indicator of where the other reports will trend in time. Note that this is already on target at 2% and portends well for the continued reduction in PCE and CPI towards that desired level.
5/1 Fed Meeting: 2pm ET is when the press release comes out. And 2:30pm is the even more important press conference with Powell where we get a lot more color commentary. Given the facts in hand investors are right to highly doubt the rate cut is happening at this time. The real key is if they showed improved language that June is in play.
Trading Plan
We are in a bull market. This is a shock to no one.
What is unclear is the pace of forthcoming gains when we are already up 50% in just 1.5 years time. Please remember that closer to 8% annual gains is the expected normal return.
I suspect 5,500 is the top of the S&P 500 (SPY) this year. Meaning that the catalyst for stocks from a rate hike is pretty much already baked into the cake.
This led me to write my previous article, Investor Alert: “Buy the Rumor, Sell the News!”
The short version is that I would not be surprised with stocks rallying into the rate cut announcement followed by a well deserved round of profit taking. Unfortunately, right around the corner form that sell off…is likely another selloff that coincides with the Presidential election pattern.
As stated before, this is not a reason to get bearish or conservative. Best to assume bull market and general upside til proven otherwise. The key is WHAT stocks will see the most gains.
We know that growth stocks generally lead the parade in the early stages of a new bull market. This is especially clear from where gains rolled in back in 2023.
What happens after a growth oriented phase is a return to value. This makes investors work a little harder to find attractive opportunities. This is where the thorough 118 factor review of our POWR Ratings model comes in quite handy.
The model does the heavy lifting by doing this deep dive into the fundamental attractiveness of the firms. The top 5% are A rated which explains why it has produced a +28.56% average annual return going back to 1999 (nearly 4X better than the S&P 500).
That top 5% is the starting point for our stock selection…then continue to drill down from there to find stocks with the most appealing upside potential.
What top stocks are we recommending now?
Read on below for the answers…
What To Do Next?
Discover my current portfolio of 12 stocks packed to the brim with the outperforming benefits found in our exclusive POWR Ratings model. (Nearly 4X better than the S&P 500 going back to 1999)
This includes 5 under the radar small caps recently added with tremendous upside potential.
Plus I have 1 special ETF that is incredibly well positioned to outpace the market in the weeks and months ahead.
This is all based on my 43 years of investing experience seeing bull markets…bear markets…and everything between.
If you are curious to learn more, and want to see these lucky 13 hand selected trades, then please click the link below to get started now.
Steve Reitmeister’s Trading Plan & Top Picks >
Wishing you a world of investment success!

Steve Reitmeister…but everyone calls me Reity (pronounced “Righty”)
CEO, StockNews.com and Editor, Reitmeister Total Return
SPY shares were trading at $523.36 per share on Thursday afternoon, up $0.19 (+0.04%). Year-to-date, SPY has gained 10.45%, versus a % rise in the benchmark S&P 500 index during the same period.
About the Author: Steve Reitmeister

Steve is better known to the StockNews audience as “Reity”. Not only is he the CEO of the firm, but he also shares his 40 years of investment experience in the Reitmeister Total Return portfolio. Learn more about Reity’s background, along with links to his most recent articles and stock picks.
The post What Data Should Investors Focus on Now? appeared first on StockNews.com
[ad_2]
Source link
Nike warned investors on Thursday that its sales revenue could fall as it cuts back on classic shoes and focuses on innovating new products.
The company expects revenue to dip by a low-single-digit percentage in the first half of its fiscal year, beginning in June, according to Reuters. Nike CFO Matthew Friend told investors in a post-results call on Thursday that the company intends to make fewer of its classics, like Air Force 1s and Pegasus running shoes, in favor of new products.
“We know Nike’s not performing at our potential,” Chief Executive Officer John Donahoe said on a conference call, according to Bloomberg. “It’s been clear that we need to make some important adjustments.”
 Nike shoes at a Macy’s store on March 21, 2024, in San Francisco, California. (Photo by Justin Sullivan/Getty Images)
Donahoe told investors that new running shoes were on their way this year, including shoes targeted at “everyday runners” with Nike Air cushion support.
Related: Casual Runners Are Racing Away From Nike and Toward Competitors — Here’s Why
Back in December, Donahoe told investors about a $2 billion savings plan to cut costs over the next three years. In February, the company stated that the plan would involve reducing its global workforce of 83,700 employees by 2%.
Nike is the world’s largest sportswear retailer, according to Statista, outpacing competitors like Adidas and Puma in footwear revenue by at least $15 billion in 2022. Footwear makes up the majority of Nike’s profits at 68%, according to the same source.
The retail giant has recently faced challenges due to shifting consumer demand for the look and feel of shoes and industry competitors like Hoka and On, per a Reuters report.
Related: ‘A Hell of a Round’: Tiger Woods Severs Partnership With Nike After 27 Year
[ad_2]
Source link
The S&P 500 (SPY) has been on a tear since November 1st when the Fed started to make their dovish tilt opening the door to future rate cuts. Unfortunately they keep not happening and start date keeps getting pushed further and further out. That has many wondering if stocks are getting ahead of themselves setting things up for a fall. Thus a good time to tune into what investment veteran Steve Reitmeister has to say about the market outlook along with his trading plan and top picks to stay ahead of the pack. Read on below for more.
As you likely remember from your English Lit classes, sometimes you have to…”Beware the Ides of March“.
That was 3/15, the date Julius Cesar was assassinated and is often viewed as an important check point for investors at this early stage of the new year.
Overall, there is not much to beware as most signs continue to point bullish. On the other hand, the S&P 500 (SPY) has rallied considerably the past few months where the overall market does seem ripe for at least a modest pullback, if not correction.
That concept and more will be at the forefront of today’s market commentary.
Market Commentary
Last week we contemplated; What Would Cause a Bear Market Now?
To boil it down, there are 2 likely causes of bear markets. First, is a looming recession which drags down earnings and risk taking leading to a thorough trimming of stock prices.
The second bear market precursor is the forming of a stock price bubble that becomes untenable. The last time that happened was back in 2000 with the bursting of the tech bubble. However, even the most ardent value investor would be hard pressed to make any such parallels to current conditions (maybe a few nosebleed AI stocks that deserve a haircut).
Putting those ideas together, there is not much reason to fear any looming bear market forming. On the other hand, there is not tremendous reason for stocks to press significantly higher as I shared in my last commentary: Is the Bull Market Growing Tired?
The main story there is about how the start date for Fed rate cuts keeps getting pushed further and further back. Please remember there was a time that folks expected that to take place in December 2023. Now we are writing off May 1st and HOPING June 12th is the starting line.
Not helping matters was the hotter than expected PPI report on Thursday morning where the month over month reading of +0.6% was twice the level expected.
With that news bond rates climbed and stocks fell on the session. Plus, the odds of a rate cut coming in June was shaved down to 60% when just a few weeks ago the probably was over 80%.
Hate to tell you this my friends, but I would say odds of a June cut is 50% at best…probably lower.
That’s because if the Fed is “data dependent” as they love to tell us, then the most recent data says that inflation is still too high. That includes the Sticky Inflation reading from earlier this week that remains over 4% and not moving fast enough towards the desired 2% target.
This calls into question if June is a real possibility when there is not enough inflation readings in that short stretch to unequivocally believe that high inflation is dead and buried. That is especially true given the Fed’s statements that they would rather cut rates too late than too early as they do not want any smoldering embers of inflation to reignite into a fire.
The most important event on the economic calendar is the March 20th Fed rate decision along with their quarterly Summary of Economic Projections. No one on the planet is expecting a rate cut at this meeting. However, they will scour every word in the report…and every statement and facial expression from Powell at the press conference looking for clues of what comes next.
No doubt someone at the press conference will ask Powell what he meant by the recent statement that rate cuts are “not far” off. Most likely, he walks that comment back with more “data dependent” talk and “better late than early” which clues investors in that even June may be too soon for the rate cut parade.
If true, then that may be the catalyst for the long awaited pullback from these current highs. Nothing scary. Just a healthy 3-5% pullback after the 25% rally from the October 2023 low.
However, there is no law that says that must happen. Instead, investors could just continue to just idle at this red light awaiting the green that eventually will happen when rates do get cut. This would be what you call a consolidation under 5,200 where the market average doesn’t move much…but results in ample sector rotation.
Some call that a “rolling correction” where each sector takes turns being on the outs even as the overall market indices don’t move much. Those sector focused sell offs cause appropriate dips in overripe positions. This is the best way to clear the path for the next healthy bull run.
Long story short, stay bullish. And stay focused on healthy growing companies that are attractively priced. The POWR Ratings continues to be your best friend in finding quality stocks.
More about that in the next section…
What To Do Next?
Discover my current portfolio of 12 stocks packed to the brim with the outperforming benefits found in our exclusive POWR Ratings model. (Nearly 4X better than the S&P 500 going back to 1999)
This includes 5 under the radar small caps recently added with tremendous upside potential.
Plus I have 1 special ETF that is incredibly well positioned to outpace the market in the weeks and months ahead.
This is all based on my 43 years of investing experience seeing bull markets…bear markets…and everything between.
If you are curious to learn more, and want to see these lucky 13 hand selected trades, then please click the link below to get started now.
Steve Reitmeister’s Trading Plan & Top Picks >
Wishing you a world of investment success!
Steve Reitmeister…but everyone calls me Reity (pronounced “Righty”)
CEO, StockNews.com and Editor, Reitmeister Total Return
SPY shares were trading at $510.73 per share on Friday morning, down $2.63 (-0.51%). Year-to-date, SPY has gained 7.45%, versus a % rise in the benchmark S&P 500 index during the same period.
About the Author: Steve Reitmeister
Steve is better known to the StockNews audience as “Reity”. Not only is he the CEO of the firm, but he also shares his 40 years of investment experience in the Reitmeister Total Return portfolio. Learn more about Reity’s background, along with links to his most recent articles and stock picks.
The post Should Investors BEWARE of this Market? appeared first on StockNews.com
[ad_2]
Source link
It’s easy to ignore bad news when the S&P 500 (SPY) is making new highs and our net worth is on the rise. Unfortunately it is often at these heights that the first signs of trouble appear…but are hard to see at first. That is why you need to read the latest insights from veteran investor, Steve Reitmeister, as he points to a disconnect between the fundamentals and current stock price action. Read on below for more.
The better than expected PCE inflation report on Thursday led to another rally pushing the S&P 500 (SPY) back towards the highs at 5,100. This represents a hearty 5% return in February. Even better, market breadth improved with smaller stocks coming along for the ride in the final days of the month.
I hate to be the bearer of bad news…but unfortunately the fundamentals are not totally supporting this rampant bullishness. Especially because I don’t believe things get that much better even after the Fed does finally start lowering rates.
Why is that?
And what does that mean for stocks in the weeks ahead?
Get the answers below with my updated outlook and trading plan.
Market Commentary
In my commentary earlier this week I shared the following insight:
We need to start the conversation with this provocative chart from FactSet comparing the movement of the forward S&P 500 EPS estimates versus the stock index:
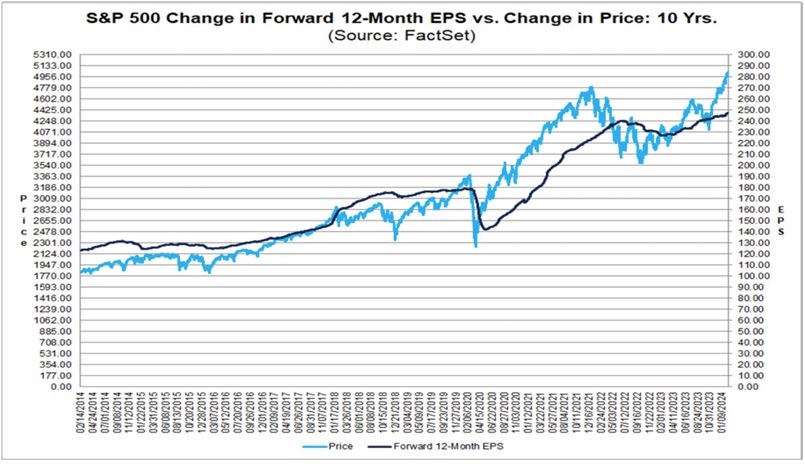
You will discover that for most of the past 10 years the dark line for earnings is above the price action. Meaning the improvement in the earnings outlook propelled stocks higher. Yet each time we find the stock index climbing above the EPS outlook it comes back down to size like it did in 2022.
If the lessons of history hold true, then it points to 2 possible outcomes.
First, would be a correction for stock prices to be more in line with the true state of the earnings outlook. Something in the range of 10% should do the trick with some of the more inflated stocks enduring a stiffer 20%+ penalty.
On the other hand, stocks could level out for a while patiently waiting for rates to be lowered. This act is a well known catalyst for greater economic growth that should finally push earnings higher getting things back in equilibrium with the index price.
Yes, there is a 3rd case where stocks just keep rallying because investors are not wholly rationale. Unfortunately, those periods of irrational exuberance led to much more painful corrections further down the road. So, let’s hope that will not be the case here.
(End of previous commentary)
However, here is what I left out of that conversation that needs to be added now. Even when the Fed finally starts lowering rates, it may not be as great of a catalyst for earnings growth and share price appreciation as investors currently believe.
Just consider what is happening now. GDP is humming along around normal levels and yet earnings growth is sub-par to non-existent year over year….why is that?
Because difficult times, like a recession, leads to more stringent cost cutting on the part of company management. This lower cost base = improved profit margins and higher growth when the economy expands once again. And yes, that is the prime catalyst for stock price advances.
But note…we didn’t have a recession. And unemployment remains strong. And thus, there was never the major cost cutting phase which ushers in the next cycle of impressive earnings growth which propels stock prices higher.
Or to put it another way, even when the Fed lowers rates…it may have a very modest impact on improved earnings growth because of what I just noted above. And this equates to less reason for stocks to ascend further.
No…this does not equate to the forming of another bear market. As noted earlier, perhaps a correction is in the offing. Or more likely that the overall market stays around current levels with a rotation out of growth stocks towards value stocks.
This is where we get to press our advantage with the POWR Ratings.
Yes, it reviews 118 factors in all for each stock finding those with the most upside potential. 31 of those factors are in the Value camp (the rest being spread across Growth, Momentum, Quality, Safety and Sentiment).
This value bias helps the POWR Ratings out every year leading to it’s average annual return of +28.56% a year going back to 1999. This year we might be able to press our advantage even more as growth prospects dim and the search for value takes center stage.
Read on in the next section for my favorite POWR Ratings value stocks to add to your portfolio at this time…
What To Do Next?
Discover my current portfolio of 12 stocks packed to the brim with the outperforming benefits found in our exclusive POWR Ratings model. (Nearly 4X better than the S&P 500 going back to 1999)
This includes 5 under the radar small caps recently added with tremendous upside potential.
Plus I have 1 special ETF that is incredibly well positioned to outpace the market in the weeks and months ahead.
This is all based on my 43 years of investing experience seeing bull markets…bear markets…and everything between.
If you are curious to learn more, and want to see these lucky 13 hand selected trades, then please click the link below to get started now.
Steve Reitmeister’s Trading Plan & Top Picks >
Wishing you a world of investment success!
Steve Reitmeister…but everyone calls me Reity (pronounced “Righty”)
CEO, StockNews.com and Editor, Reitmeister Total Return
SPY shares were trading at $512.85 per share on Friday afternoon, up $4.77 (+0.94%). Year-to-date, SPY has gained 7.90%, versus a % rise in the benchmark S&P 500 index during the same period.
About the Author: Steve Reitmeister
Steve is better known to the StockNews audience as “Reity”. Not only is he the CEO of the firm, but he also shares his 40 years of investment experience in the Reitmeister Total Return portfolio. Learn more about Reity’s background, along with links to his most recent articles and stock picks.
The post Stock Investors: Why Are You So Bullish??? appeared first on StockNews.com
[ad_2]
Source link
The industrial sector is well-positioned for robust growth and expansion, propelled by consumer demand for industrial products and services, infrastructure development, government backing, and technological advances. Thus, quality industrial stocks Siemens Aktiengesellschaft (SIEGY), AptarGroup (ATR), and Amada Co. (AMDLY) could be ideal buys for potential gains. Read more….
The industrial sector, which includes manufacturing, construction, and more, has a solid footing, with several factors such as technological innovation, sustained consumer demand for industrial products and services, growing investments in infrastructure, and favorable government funding and policies, attributing to the sector’s growth.
Given the industry’s tailwinds, it could be wise to invest in fundamentally sound industrial stocks Siemens Aktiengesellschaft (SIEGY), AptarGroup, Inc. (ATR), and Amada Co. Ltd. (AMDLY) for substantial returns.
Despite labor shortages and continued supply chain disruptions, the manufacturing industry stands sturdy and will continue to witness significant growth in the foreseeable future. Production of industrial goods, including aircraft, automobiles, chemicals, consumer electronics, heavy machinery, oil, and steel, is exceeding pre-pandemic levels.
With the rapid expansion of the manufacturing sector, the industrial machinery industry is poised for significant profitability in the upcoming years. Further, the industry’s prospects are driven by the demand for automation and the modernization of the production process. The industrial machinery market is estimated to reach $777.35 billion in 2028, growing at a CAGR of 7.2%.
The industrial packaging market is also picking pace with the increasing volume of resources and products being transported across various regions. Amid the rigid plastic regulations, more and more companies are engaging and launching new and innovative products in line with the changing demand for sustainable and recyclable industrial packaging.
The industrial packaging market is expected to be valued at $66.27 billion in 2024. The market is further anticipated to grow at a CAGR of 4.7% during the forecast period (2024-2029), resulting in a market volume of $83.45 billion by 2029.
Supportive government funding & policies and numerous technological advancements will further shape industrial manufacturing trends this year and beyond.
Government initiatives, such as the CHIPS and Science Act, which allocates $50 billion for the domestic semiconductor industry, and the Infrastructure Investment and Jobs Act (IIJA), which sets aside $1.2 trillion for transportation and infrastructure, are creating new avenues for the industry players.
The manufacturing sector is notably making a transformative shift from machine-based assembly lines to “smart factories,” using AI, the Internet of Things (IoT), robotics, data analytics, and other advanced technologies. The movement, known as Industry 4.0, is the next stage of the digitalization of manufacturing, fueled by advances in automation and connectivity.
Investor’s interest in industrial stocks is evident from the Industrial Select Sector SPDR Fund’s (XLI) 10.4% returns over the past six months.
Given the industry’s solid growth prospects, investing in fundamentally strong industrial stocks SIEGY, ATR, and AMDLY could be wise for future gains.
Let’s discuss the fundamentals of these stocks in detail:
Siemens Aktiengesellschaft (SIEGY)
Headquartered in Munich, Germany, SIEGY is a leading technology company that emphasizes automation and digitalization worldwide. The company operates through Digital Industries; Smart Infrastructure; Mobility; Siemens Healthineers; and Siemens Financial Services (SFS) segments.
On February 15, 2024, SIEGY supplied 200 VersiCharge wallboxes and an intelligent charging management system to the Portuguese Infinity building, one of the tallest residential sites in Lisbon, Portugal. The contract includes delivery of SICAM Dynamic Load Management, a solution by SIEGY to use grid capacity efficiently.
With this deal, SIEGY is preparing one of Portugal’s tallest buildings for the future of eMobility. The integrated EV (Electric Vehicle) charging solution customized by SIEGY’s engineering and software teams in Portugal allows for dynamic and intelligent on-site charging management.
On February 6, SIEGY and Italian distribution system operator (DSO), Areti announced their collaboration on the RomeFlex project to test the ability to manage congestion and voltage volatility across the stressed power grids of Italy’s capital city. Areti will use SIEGY’s technology to forecast grid congestion and request flexibility on MV and LV grids.
With SIEGY’s expertise and software, Areti is managing challenges related to climate change and ‘the electrification of everything,’ heavily impacting power grids in Italy and all around the world.
Also, on February 5, SIEGY announced the release of a new generative artificial intelligence (AI) functionality into its predictive maintenance solution – Senseye Predictive Maintenance. The new generative AI functionality makes predictive maintenance more conversational and intuitive.
With the new release, SIEGY will make human-machine interactions and predictive maintenance more efficient and faster by enhancing proven machine learning capabilities with generative AI.
For the fiscal 2024 first quarter that ended December 31, 2023, SIEGY’s revenue grew 1.9% year-over-year to €18.41 billion ($19.84 billion). The company’s gross profit rose 3.1% year-over-year to €7.18 billion ($7.74 billion). Its income from continuing operations came in at €2.53 billion ($2.73 billion), up 54.2% from the prior year’s quarter.
In addition, SIEGY’s net income for the quarter amounted to €2.55 billion ($2.74 billion), or €2.99 per share, a 55.7% and 61.6% growth from the previous year’s quarter, respectively. Its free cash flow from continued and discontinued operations was €1.05 billion ($1.13 billion), an increase of 1,118.6% year-over-year.
Street expects SIEGY’s revenue for the third quarter (ending June 2024) to increase 3.9% year-over-year to $21.55 billion. The company’s EPS for the same quarter is expected to grow 38.5% year-over-year to $1.26. Moreover, the company topped the consensus EPS estimates in three of the trailing four quarters, which is impressive.
Shares of SIEGY have surged 21.6% over the past six months and 15.5% over the past year to close the last trading session at $90.71.
SIEGY’s solid fundamentals are reflected in its POWR Ratings. The stock has an overall rating of B, which translates to a Buy in our proprietary rating system. The POWR Ratings are calculated by considering 118 different factors, each weighted to an optimal degree.
SIEGY has a B grade for Value, Growth, and Stability. It is ranked #3 out of 35 stocks in the B-rated Industrial – Manufacturing industry.
In addition to the POWR Ratings we’ve stated above, we also have SIEGY ratings for Momentum, Sentiment, and Quality. Get all SIEGY ratings here.
AptarGroup, Inc. (ATR)
ATR designs and manufactures a variety of drug delivery, consumer product dispensing, and active material science solutions and services for markets, including pharmaceutical, beauty, personal care, home care, and food and beverage. It operates through Aptar Pharma; Aptar Beauty; and Aptar Closures segments.
On February 9, 2024, ATR’s Aptar Digital Health and Biogen Inc. (BIIB) entered into an enterprise agreement to operate and develop digital health solutions for neurological and rare diseases. Under the agreement, Biogen will transfer ownership of select digital health solutions to Aptar Digital Health.
The new partnership model leverages Aptar Digital Health’s capabilities to assist in the development and operation of new and existing digital health solutions globally. The initial scope of the multi-year agreement covers various indications in neurology and immunology across 15 countries.
On January 19, ATR declared a quarterly cash dividend of $0.41 per share. The payment date for the dividend is February 22, 2024, to stockholders of record as of February 1, 2024.
ATR pays an annual dividend of $1.64, which translates to a yield of 1.19% at the current share price. Its four-year average dividend yield is 1.27%. Moreover, the company’s dividend payouts have increased at a CAGR of 3.8% over the past three years. Aptar has raised its dividends for 30 consecutive years.
During the fourth quarter that ended December 31, 2023, ATR’s net sales increased 5.3% year-over-year to $838.48 million. Adjusted net income attributable to ATR rose 28.6% and 27.4% from the prior year’s quarter to $81.45 million and $1.21 per share, respectively. Its adjusted EBITDA was $179.45 million, up 22.3% year-over-year.
In addition, the company’s free cash flow came in at $138.49 million, an increase of 40.3% from the previous year’s period.
Analysts expect ATR’s revenue and EPS for the first quarter (ending March 2024) to increase 3.9% and 20.8% year-over-year to $893.45 million and $1.15, respectively. Furthermore, the company has surpassed the consensus EPS estimates in each of the trailing four quarters.
ATR’s stock has gained 13.1% over the past six months and 24.2% over the past year to close the last trading session at $137.50.
ATR’s bright prospects are reflected in its POWR Ratings. The stock has an overall rating of B, equating to a Buy in our proprietary rating system.
The stock has a B grade for Growth, Quality, Stability, and Sentiment. ATR is ranked #4 among 19 stocks in the B-rated Industrial – Packaging industry.
Click here to access all ATR’s ratings.
Amada Co. Ltd. (AMDLY)
Based in Isehara, Japan, AMDLY manufactures, sells, leases, repairs, maintains, checks, and inspects metalworking machinery, software, and peripheral equipment in Japan, North America, Europe, Asia, and internationally. The company offers sheet metal fabrication machines, including laser machines and punch & laser combination machines.
On October 4, 2023, AMDLY announced the three-dimensional laser integrated system, “ALCIS-1008e,” at Photonix 2023. The ALCIS (Advanced Laser Cube Integrated System) is a three-dimensional laser integrated system that can perform various types of laser machining like cutting, welding, and layered manufacturing, all in one machine.
With the new system, AMDLY can support the high-speed and high-quality processing of highly reflective materials such as copper, for which demand is increasing. The system provides high-precision laser machining to meet the needs of highly variable manufacturing.
On September 5, AMDLY commenced the sales of its new products in the HRB series of next-generation large press brakes. These machines expand the range of possible processing by enabling the bending and deep bending of thick sheet metal and large items.
The new HRB series products expand the large-scale machine range to seven models, with support for long and med-to-thick material from 350 tons/3 meters to 600 tons/7 meters. It enables support for steel material processing and also considers environmental concerns.
In the nine months that ended December 31, 2023, AMDLY’s sales revenue increased 10.2% year-over-year to ¥285.22 billion ($1.90 billion), while its gross profit rose 10.9% from the prior year’s period to ¥125.90 billion ($838.18 million). Its operating profit came in at ¥40.25 billion ($268 million), up 15% year-over-year.
Furthermore, the company’s net income and earnings per share amounted to ¥28.01 billion ($186.48 million) and ¥81.51, indicating increases of 16.5% and 17.9% year-over-year, respectively.
As per the company’s updated guidance for the fiscal year 2023, AMDLY’s sales revenue is expected to be ¥395 billion ($2.63 billion). The company expects gross profit of ¥175 billion ($1.16 billion) and net income of ¥39 billion ($259.64 million).
Street expects AMDLY’s revenue for the fiscal year (ending March 2024) to increase 96.7% year-over-year to $2.66 billion. In addition, the company has surpassed the consensus revenue estimates in three of the trailing four quarters.
Over the past six months, the stock has gained 17.8% to close the last trading session at $40.51.
AMDLY’s POWR Ratings reflect its promising outlook. The stock has an overall rating of A, which translates to a Strong Buy in our proprietary rating system.
The stock has an A grade for Value and a B for Quality and Stability. Within the A-rated Industrial – Machinery industry, AMDLY has topped the list of 80 stocks.
Click here to access additional ratings of AMDLY for Growth, Momentum, and Sentiment.
What To Do Next?
43 year investment veteran, Steve Reitmeister, has just released his 2024 market outlook along with trading plan and top 11 picks for the year ahead.
SIEGY shares were unchanged in premarket trading Monday. Year-to-date, SIEGY has declined -1.02%, versus a 5.09% rise in the benchmark S&P 500 index during the same period.
About the Author: Mangeet Kaur Bouns

Mangeet’s keen interest in the stock market led her to become an investment researcher and financial journalist. Using her fundamental approach to analyzing stocks, Mangeet’s looks to help retail investors understand the underlying factors before making investment decisions.
The post 3 Industrial Stocks With Future Gains for Investors appeared first on StockNews.com
[ad_2]
Source link
The S&P 500 (SPY) seems to be breaking out into bull market territory above 4,200. However, history shows many examples of how this could be nothing more than a Suckers Rally. That’s why you should tune into Steve Reitmeister’s most recent market commentary including a clear trading plan and top picks for this unique market environment. Get the full story below.
Stocks rallied this past week on the news that a debt ceiling showdown is likely to be averted. To that I say a big, hearty…
DUH!
That’s because politicians never leave their finger in this light socket for long. It is always magically resolved in the nick of time.
When the smoke cleared from this rally investors realized they do not have the resolve to truly break into bullish territory above 4,200 for the S&P 500 (SPY). This likely means more limbo and trading range lie ahead as investors await a REAL catalyst to resolve the bull/bear debate once and for all.
Let’s review why this is the case…and what potential catalysts are on the calendar that could produce the next big move for the stock market.
Market Commentary
The short version of my current market outlook was nicely summarized as follows from my previous commentary:
“There has been a tug of war taking place all year between bulls and bears. It would seem that bulls grabbed the early lead given how stocks shot up near 4,200 by early February…but since then stocks have traded in a narrow range where bulls & bears seem fairly balanced.
Bears will say that the storm clouds are still forming for a recession and deeper bear market thanks to a hawkish Fed dead set on creating a recession to put an end to high inflation.
Bulls will say that the long feared recession keeps NOT happening. And maybe never will. Thus, the lows are already in and the new long term bull market has already begun.
Right now, these 2 opposing views are pretty evenly matched creating a narrow trading range and a considerable drop in volatility. That sleepy action will end when the bulls or bears can wave the victory flag. Until then…the sleepy range bound action will continue.”
(Read the full version of the above commentary here: The WORST Stock Market Ever- Part 2)
Even though stocks rallied this week up to 4,200. Truly nothing has changed to convincingly win the bull/bear battle. In fact, most of the substantive recent news has been negative.
Like Retail Sales coming in at only +1.6% year over year. When you remove +4.9% for inflation (CPI) it shows a -3.3% drop for US retail.
This fits in with the general high inflation narrative that consumers become fearful of waiting to purchase products that leads to a seeming boom in GDP in the near term. This is followed by an economic cliff as demand has been pulled forward. Indeed, that precursor to recession may be happening now.
Those looking to the Fed for signs of a pivot to lower rates should be disappointed by what they heard this week.
First was the Dallas Fed President Logan who said current data does not justify pausing rates hikes yet. Next on Friday morning Chairman Powell was giving a speech reemphasizing that inflation is still far too high and that the Fed would stay “steadfast” in their goal to lower prices.
This means that bulls should once again be disappointed to hear the hawkish resolve the Fed is likely to reiterate at the next announcement on June 14th. But even that is not enough to win the day for bears either.
Investors will need to see unequivocal proof of a recession on the way for the bear market to reemerge. This would have stocks breaking below the 200 day moving average at 3,976 and likely retesting the October lows of 3,491…if not lower. (That break below 3,976 should be your trigger to get more bearish).
This has us back on “catalyst watch” for any events that end this bull/bear stand off in convincing fashion. Here is the roll call of the key events on the calendar that could serve as that catalyst:
5/25 Jobless Claims– This will not be strong enough by itself as investors would look for collaboration from the 6/2 Government Employment Situation report. However, if Jobless Claims start to approach 300,000 per week, then historically that has pointed to the time that the unemployment rate is about to rise for quite a while.
5/31 ADP Employment, JOLTs– 2 other jobs reports that often serve as leading indicators of what is in store with monthly Government Employment Situation.
6/1 ISM Manufacturing, Jobless Claims- there have been MANY weak readings for ISM Manufacturing without truly signaling a recession was at hand. However, this is still one of the key monthly reports to monitor on the health of the economy.
6/2 Government Employment Situation- Job adds are expected to keep ebbing lower down to 180,000 this month. Note that population growth demands 150,000 job adds per month to keep the unemployment rate level. So, any movement under that mark could have investors predicting even worse readings ahead. Also, many eyes will be on the Wage Inflation component as that sticky inflation has been clearly bothersome to the Fed.
6/5 ISM Services- Has been in positive territory at 53.4 last month. But if that cracks under 50 into contraction territory it definitely would increase the odds of a recession ahead.
6/14 Fed Meeting- More investors are expecting that they will pause raising rates. But that is quite different than pivoting to lower rates which they still claim is a 2024 event. So, the Powell press conference that follows the rate hike decision will be closely watched for clues of what comes next.
All in all, I still believe we should take the Fed at their word that a recession will take place before inflation is properly tamed. And once that Pandoras Box is opened…then things can get ugly in a hurry with much lower stock prices on the way. That is why I am not tempted to join the bulls even as they are knocking on the door with a potential breakout above 4,200.
Reity, are you saying its not possible to break out above 4,200 now?
I am not saying that because with the stock market anything is possible.
However, looking back at history there have been many false starts to a new bull market that later failed…and failed miserably.
Most notable is the greater than 20% rally from November 2008 through early Jan 2009 that technically marked a new bull market. This sucked in a lot of excited investors only for the bear market to return with a vengeance with lower lows on the way (focus on the arrows in the chart below).
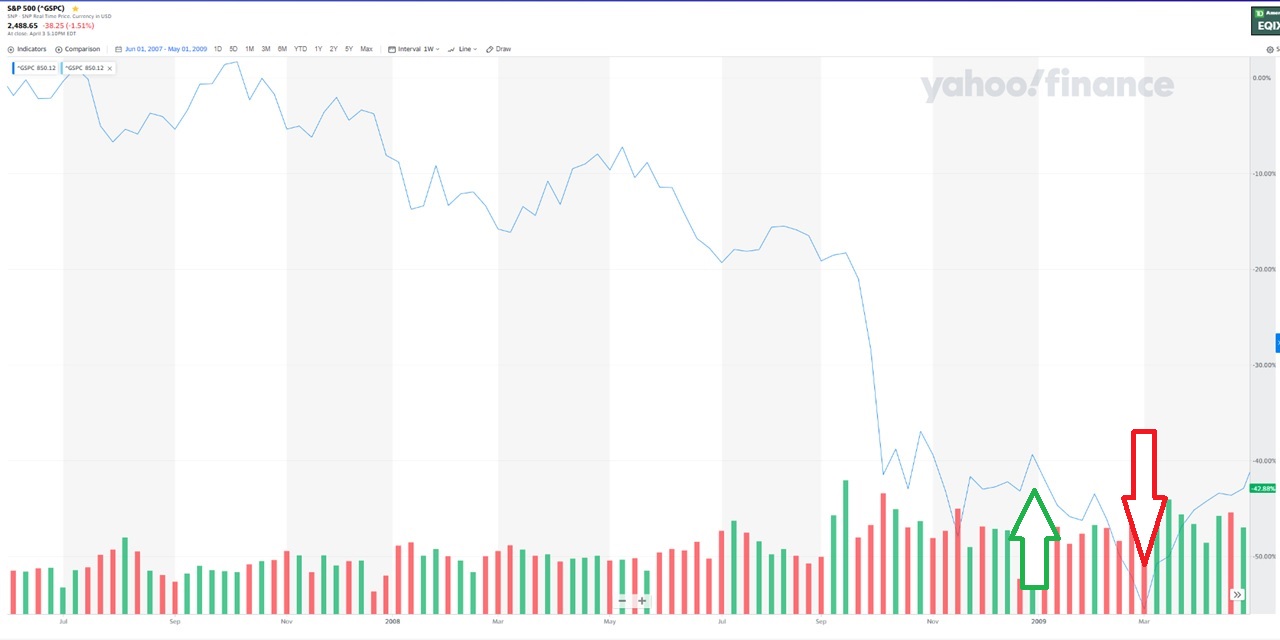
So just breaking above 4,200 for a little while without a clear fundamental catalyst would not entice me to chase stocks because of the great likelihood of it being a “suckers rally”.
Yes, at some point the emergence of the next bull market will make a lot of sense. Right now it simply doesn’t given the still high odds of recession ahead which begets lower corporate earnings and lower share prices (the market has always worked this way…and suspect always will).
So, please continue to stay balanced with in your portfolio which means about 50% long stocks. Then when the CLEAR bull or bear catalyst emerges, then make the rest of your moves to join that bandwagon.
What To Do Next?
Discover my balanced portfolio approach for uncertain times. The same approach that has beaten the S&P 500 by a wide margin in recent months.
This strategy was constructed based upon over 40 years of investing experience to appreciate the unique nature of the current market environment.
Right now, it is neither bullish or bearish. Rather it is confused and uncertain.
Yet, given the facts in hand, we are most likely going to see the bear market coming out of hibernation mauling stocks lower once again.
Gladly we can enact strategies to not just survive that downturn…but even thrive. That’s because with 40 years of investing experience this is not my first time to the bear market rodeo.
If you are curious in learning more, and want to see the hand selected trades in my portfolio, then please click the link below to start getting on the right side of the action:
Steve Reitmeister’s Trading Plan & Top Picks >
Wishing you a world of investment success!
Steve Reitmeister…but everyone calls me Reity (pronounced “Righty”)
CEO, StockNews.com and Editor, Reitmeister Total Return
SPY shares fell $0.64 (-0.15%) in after-hours trading Friday. Year-to-date, SPY has gained 9.88%, versus a % rise in the benchmark S&P 500 index during the same period.
About the Author: Steve Reitmeister
Steve is better known to the StockNews audience as “Reity”. Not only is he the CEO of the firm, but he also shares his 40 years of investment experience in the Reitmeister Total Return portfolio. Learn more about Reity’s background, along with links to his most recent articles and stock picks.
The post Investors: DON’T Get Fooled by This Suckers Rally appeared first on StockNews.com
[ad_2]
Source link
The S&P 500 (SPY) seems to be going trading in a fairly tight trading range. Yet there are more facts emerging that would lead one to a bearish conclusion. That includes the discussion of Sticky Inflation. You may not have thought much about that…but let me assure you that is Public Enemy #1 for the Fed. Read on below to understand how Sticky Inflation is increased the odds of bear market downside in the weeks ahead.
Earlier this week I shared an important proclamation that I was getting more bearish. The reasons for which are clearly spelled out here.
One of the key points is that inflation is still too high which is why the Fed is still slamming on the brakes of the economy with their hawkish regimen. This may be hard for some to see who point to a great reduction in gas prices as proof the inflationary beast has been tamed.
Unfortunately, we still have a “sticky” situation at hand thanks to sticky inflation. Let’s dive into this too little discussed subject to appreciate why the odds are pointing more bearish in the weeks ahead.
Market Commentary
The conventional view of inflation is to watch the movement of the Consumer Price Index (CPI). See below the clear and steady decline of that key measure over the past year:

That is serious and consistent improvement that gives some the sense that we don’t need to do that much more to coast down to the Fed’s stated 2% inflation target. This is why so many investors keep betting on a Fed pivot to let off the brakes and start lowering rates.
THAT IS NOT GOING TO HAPPEN ANY TIME SOON!
First, because the Fed keeps repeating that rates will not be lowered this year. This happens at every single Fed announcement much to the chagrin of investors who oddly suspect they will change their tune by September. I almost feel like Powell wants to say things like “Read my lips” or “Did I stutter?”.
Second, and more importantly, because the Fed is basing their decisions on sound logic. That being that there is more to the inflation equation than just CPI. And that not all inflation elements are made equal.
Enter the Conversation About “Sticky Inflation”
The Atlanta Fed leads this effort to break up the CPI report into 2 sub indices:
- Flexible CPI (where prices change quickly)
- Sticky CPI (where prices change slowly)
As you will see in their most recently updated chart below, overall inflation may be down, but Sticky inflation is stubbornly high at +6.5% year over year (yes, even more than the +4.9% CPI reading).

Below is a good summary of what is in each sub index. But for simplicity the majority of the problem in Sticky Inflation comes from housing/shelter (OER below), medical services, recreation & restaurant prices.

Plain and simple, the Fed is on a mission to stamp out inflation. And no matter what some investors think they see in the improvement of CPI or gas prices…they are not economists and don’t appreciate the totality of the inflation story.
Now let’s remember that Fed officials are indeed economists and academics who fully understand these intricate concepts. They absolute see and understand the problem with sticky inflation and are firmly planning to eradicate it which is why rates will stay high through years end…or even longer.
And yes, the Fed is FULLY aware that this likely will create a recession. In fact, that is still their base case by years end. (This concept is the cornerstone of my argument for becoming more bearish as shared in my recent commentary).
This brings us back to the importance of being vigilant on our recession watch as more signs of that becoming a reality will wake the bear from hibernation leading to new stock lows. The key to the recession watch has been employment which has been incredibly resilient.
The leading indicator of the monthly Government Employment Situation report is the weekly Jobless Claims report every Thursday. As you will see in the chart below this has been ticking up little by little over time. The key for most is if it reaches 300,000+ per week which is usually a sign that the unemployment rate is about to rise.

Jumping of the chart above is the 10% week over week spike in claims to 264,000. So this indicator is not in troubling territory yet, but directionally we are getting closer to the point where unemployment may rise, which would most certainly sound more recessionary alarms…and get stocks moving lower.
How Does This Affect Our Trading Plan?
Let me borrow some key statements from my 5/9/23 Reitmeister Total Return commentary which applies just as well here.
“My recommendation is to stay balanced (bullish/bearish) like we are doing in Reitmeister Total Return until the recession starts to rear its ugly head. That because there have been many false recessionary alarms over the past 15 months that did not come to fruition leading to a rise in stock prices.
Your best bear trading signal is when the market finally cracks below the 200 day moving average (currently at 3,975). From there a bearish FOMO rally should kick in with 10-20% more downside to eventual bottom.
Why not shift more bearish now?
Because if only 65% certain of bearish outcome…that means I still see a 35% chance that recession and deeper bear does NOT happen. So, we want more of the cards to be put on the table before we make a deeper bearish bet.”
What To Do Next?
Discover my balanced portfolio approach for uncertain times. The same approach that has beaten the S&P 500 (SPY) by a wide margin in recent months.
This strategy was constructed based upon over 40 years of investing experience to appreciate the unique nature of the current market environment.
Right now, it is neither bullish or bearish. Rather it is confused…volatile…uncertain.
Yet, given the facts in hand, we are most likely going to see the bear market coming out of hibernation mauling stocks lower once again.
Gladly we can enact strategies to not just survive that downturn…but even thrive. That’s because with 40 years of investing experience this is not my first time to the bear market rodeo.
If you are curious in learning more, then please click the link below to start getting on the right side of the action:
Steve Reitmeister’s Trading Plan & Top Picks >
Wishing you a world of investment success!
Steve Reitmeister…but everyone calls me Reity (pronounced “Righty”)
CEO, StockNews.com and Editor, Reitmeister Total Return
SPY shares fell $0.59 (-0.14%) in after-hours trading Friday. Year-to-date, SPY has gained 8.04%, versus a % rise in the benchmark S&P 500 index during the same period.
About the Author: Steve Reitmeister
Steve is better known to the StockNews audience as “Reity”. Not only is he the CEO of the firm, but he also shares his 40 years of investment experience in the Reitmeister Total Return portfolio. Learn more about Reity’s background, along with links to his most recent articles and stock picks.
The post Why Are Investors in a “Sticky Situation”? appeared first on StockNews.com
[ad_2]
Source link
Retail REITs have been under pressure amid the growth of e-commerce. So, we think Macerich (MAC) and Urban Edge (UE) should be avoided considering their weak fundamentals. Let’s discuss this in detail.
The increasingly difficult macroeconomic climate has particularly badly struck the real estate investment trusts (REITs) market.
Given the current macroeconomic backdrop of high inflation and interest rate hikes, we think The Macerich Company (MAC) and Urban Edge Properties (UE) might be best avoided now, considering their bleak fundamentals.
The retail landscape has changed dramatically with the decline of brick-and-mortar retail. E-commerce sales have been increasing amid changing consumer preferences. The impressive growth of the e-commerce market might keep retail REITs under pressure.
Moreover, Tom Hainlin, national investment strategist at U.S. Bank, said, “Although REITs are often considered a way to hedge the risk of higher inflation, the unfavorable interest rate environment resulted in REITs underperforming other parts of the equity market.”
Let’s discuss the stocks mentioned above in detail.
The Macerich Company (MAC)
MAC is a fully integrated, self-managed, and self-administered real estate investment trust (REIT).
MAC’s trailing-12-month EV/EBIT of 53.71x is 60.7% higher than the industry average of 33.42x.
For the first quarter of the fiscal first quarter that ended March 31, 2023, MAC’s total revenues decreased marginally year-over-year to $214.85 million. However, its net loss came in at $58.73 million, up 59% year-over-year. Its loss per share came in at $0.27, up 58.8% year-over-year.
Analysts expect MAC’s revenue to decrease 5.3% year-over-year to $813.9 million in 2023. Its EPS is expected to decline 8.6% year-over-year to $1.76 in 2023. It missed EPS estimates in all the four trailing quarters. MAC has lost 26.2% over the past three months to close the last trading session at $9.71.
MAC’s POWR Ratings reflect its bleak outlook. The stock has an overall D rating, which equates to a Sell in our rating system. The POWR Ratings assess stocks by 118 different factors, each with its own weighting.
MAC has an F grade for Sentiment and a D for Quality. The stock is ranked #28 out of 30 stocks in the D-rated REITs – Retail category. Click here for additional ratings for MAC’s Growth, Stability, Momentum, and Value.
Urban Edge Properties (UE)
UE is an NYSE-listed real estate investment trust focused on managing, acquiring, developing, and redeveloping retail real estate in urban communities, primarily in the New York metropolitan region.
UE’s trailing-12-month Price/Book of 1.80x is 32.7% higher than the industry average of 1.36x. Its trailing-12-month non-GAAP P/E of 31.64x is 22.7% higher than the industry average of 25.79x.
UE’s total revenue decreased marginally year-over-year to $99.44 million for the first quarter of the fiscal year that ended March 31, 2023. However, its net loss came in at $19.11 million, compared to a net income of $9.49 million in the year-ago period. Its loss per share came in at $0.16, compared to EPS of $0.08 for the same period the prior year.
UE’s revenue is expected to decline 2.5% year-over-year to $99.03 million for the fourth quarter December 2023. Its EPS is expected to decrease by 13.1% year-over-year to $0.29 for the same period. The stock has lost 12.7% over the past nine months to close the last trading session at $14.36.
UE’s POWR Ratings reflect its fundamental weakness. The stock has an overall rating of D, translating to a Sell in our proprietary rating system. It has a D grade for Growth. UE is ranked #26 in the same category.
Beyond what we’ve stated above, we have also given UE grades for Value, Sentiment, Momentum, Stability, and Quality. Get all UE ratings here.
Discover 10 widely held stocks that our proprietary model shows have tremendous downside potential. Please make sure none of these “death trap” stocks are lurking in your portfolio:
MAC shares were trading at $9.51 per share on Thursday afternoon, down $0.20 (-2.06%). Year-to-date, MAC has declined -14.45%, versus a 8.01% rise in the benchmark S&P 500 index during the same period.
About the Author: Rashmi Kumari

Rashmi is passionate about capital markets, wealth management, and financial regulatory issues, which led her to pursue a career as an investment analyst. With a master’s degree in commerce, she aspires to make complex financial matters understandable for individual investors and help them make appropriate investment decisions.
The post 2 REITs Investors Are Avoiding appeared first on StockNews.com
[ad_2]
Source link
Despite widespread recession concerns, the long-term prospects of the technology industry look attractive. Hence, fundamentally strong tech stocks Motorola (MSI), Ribbon (RBBN), and AudioCodes (AUDC) might be worth buying. Keep reading.
Game-changing technologies like chatGPT are hitting tipping points for mass adoption. The tech industry is in a favorable position to reap long-term benefits due to constant advancements and the rising need for digital transformation across various industries.
As the industry shows solid potential, fundamentally strong tech stocks Motorola Solutions, Inc. (MSI), Ribbon Communications Inc. (RBBN), and AudioCodes Ltd. (AUDC) might be solid buys.
The introduction of blockchain technology has been a game-changer, transforming how we approach data storage and transactions. Moreover, the development of standard tools, like ChatGPT, is making it easier for developers of all levels to work with blockchain technology.
Gartner predicts spending to reach $4.5 trillion in 2023, a 2.4% rise from previous years.
John-David Lovelock, Distinguished VP Analyst at Gartner, said, “Consumers and enterprises are facing very different economic realities. While inflation is devastating consumer markets, contributing to layoffs at B2C companies, enterprises continue to increase spending on digital business initiatives despite the world economic slowdown.”
Let’s discuss the stocks mentioned above in detail:
Motorola Solutions, Inc. (MSI)
MSI provides public safety and enterprise security solutions in the United States, the United Kingdom, Canada, and internationally. The company operates in two segments, Products and Systems Integration; and Software and Services.
On May 2, 2023, MSI launched its next-generation V700 body camera with mobile broadband capabilities to give public safety agencies another critical source of real-time field intelligence and collaboration. The V700 seamlessly integrates with Aware, a cloud-based platform that provides a common operating view – as well as the M500 in-car video system, APX radios, and Holster Aware sensors.
This ecosystem of connected technologies offers command staff officer location and multiple points-of-view of an incident as it unfolds to improve response and officer safety.
Its trailing-12-month EBITDA margin of 28.05% is 201.5% higher than the 9.30% industry average. Its trailing-12-month net income margin of 14.63% is 461.1% higher than the 2.61% industry average.
MSI pays a $3.52 per share dividend annually, translating to a 1.24% yield on the current price. Its dividend payments have grown at a CAGR of 11.3% over the past three years. The company has a four-year average dividend yield of 1.39%.
During the fiscal first quarter ended March 31, 2023, MSI’s net sales increased 14.7% year-over-year to $2.17 billion. Net earnings attributable to MSI grew 4.1% year-over-year to $278 million, while its earnings per common share increased 4.5% year-over-year to $1.61.
MSI’s EPS is expected to increase 21.6% year-over-year to $2.52 for the fiscal second quarter ending June 2023. The company’s revenue for the same quarter is expected to increase 10.3% year-over-year to $2.36 billion. Additionally, it has topped consensus revenue and EPS estimates in each of the trailing four quarters, which is impressive.
Shares of MSI have gained 41.8% over the past year to close the last trading session at $286.57.
MSI’s POWR Ratings reflect its promising outlook. The stock has an overall rating of B, which translates to a Buy in our proprietary rating system. The POWR Ratings are calculated by considering 118 different factors, with each factor weighted to an optimal degree.
The stock has a B grade for Sentiment, Growth, and Quality. It is ranked #9 out of 51 stocks in the Technology – Communication/Networking industry.
Beyond what is stated above, we’ve also rated MSI for Value, Stability, and Momentum. Get all MSI ratings here.
Ribbon Communications Inc. (RBBN)
RBBN provides communications technology in the United States, Europe, the Middle East, Africa, the Asia Pacific, and internationally. It operates through two segments, Cloud and Edge; and IP Optical Networks.
On April 25, RBBN announced that Valley Telecommunications, a South Dakota provider of telephone, Internet, and television services, has selected Ribbon to upgrade its network and provide a tenfold increase in bandwidth for local residents and businesses.
On April 24, RBBN announced that kölbi Negocios, a Costa Rica-based Grupo ICE company that offers cutting-edge electricity and telecommunications solutions, has deployed Ribbon Connect for Microsoft Teams Direct Routing.
Its trailing-12-month gross profit margin of 52.23% is 5.7% higher than the 49.43% industry average. Its trailing-12-month asset turnover ratio of 0.68x is 9.9% higher than the 0.62x industry average.
RBBN’s revenues rose 7.5% year-over-year to $186 million in the fiscal second quarter that ended March 31, 2023. Non-GAAP net loss decreased 25% year-over-year to $3 million, while its non-GAAP loss per share decreased 75% year-over-year to $0.02.
Street expects RBBN’s revenue for the fiscal second quarter ending June 2023 to increase 2.7% year-over-year to $211.41 million. The company’s EPS for the same quarter is expected to come in at $0.04. Additionally, it has topped consensus EPS estimates in three of the trailing four quarters.
The stock has gained 2% over the past six months to close the last trading session at $2.59.
RBBN’s robust prospects are reflected in its POWR Ratings. The stock has an overall B rating, equating to a Buy in our proprietary rating system.
RBBN has an A grade for Growth, Value, and Sentiment. It is ranked #10 in the same industry.
Click here to see the additional POWR Ratings for RBBN (Momentum, Stability, and Quality).
AudioCodes Ltd. (AUDC)
Headquartered in Lod, Israel, AUDC vides advanced communications software, products, and productivity solutions for the digital workplace. The company offers solutions, products, and services for unified communications, contact centers, VoiceAI business line, and service provider businesses.
AUDC’s trailing-12-month gross profit margin of 64.99% is 31.4% higher than the 49.47% industry average. Its trailing-12-month asset turnover of 0.82x is 10% higher than the 0.62x industry average.
AUDC pays $0.36 annually as dividends which translates to a yield of 3.66% at the current price. Its 4-year average dividend yield is 1.29%. Its dividend has grown at a CAGR of 12.9% over the past three years.
AUDC’s services revenues increased 10.8% to $30.52 million in the first quarter that ended March 31, 2022. Also, its gross profit came in at $36.54 million. Its non-GAAP net earnings per share came in at $0.08.
AUDC’s revenue is expected to come in at $60.36 million for the fiscal second quarter ending June 2023. The company’s EPS for the same quarter is expected to be $0.10.
AUDC declined 1.6% intraday to close its last trading session at $9.83.
AUDC’s POWR Ratings reflect its robust outlook. The stock has an overall rating of B, which translates to a Buy in our proprietary rating system.
AUDC also has an A grade for Quality and a B for Value. It is ranked #6 in the same industry.
For additional ratings for AUDC’s Growth, Momentum, Stability, and Sentiment, click here.
The Bear Market is NOT Over…
That is why you need to discover this timely presentation with a trading plan and top picks from 40 year investment veteran Steve Reitmeister:
REVISED: 2023 Stock Market Outlook >
MSI shares were unchanged in premarket trading Wednesday. Year-to-date, MSI has gained 11.57%, versus a 7.86% rise in the benchmark S&P 500 index during the same period.
About the Author: Nidhi Agarwal

Nidhi is passionate about the capital market and wealth management, which led her to pursue a career as an investment analyst. She holds a bachelor’s degree in finance and marketing and is pursuing the CFA program.
Her fundamental approach to analyzing stocks helps investors identify the best investment opportunities.
The post 3 Tech Stocks Investors are Buying Now appeared first on StockNews.com
[ad_2]
Source link
After a strong 2022, the energy sector could show strength this year as well due to production cuts by OPEC+, the long lead time to ramp up new supply and refining capacity, and the revival of demand in China. Therefore, it could be wise to buy fundamentally strong energy stocks MPLX LP (MPLX), Gibson Energy (GBNXF), and CONSOL Energy (CEIX). Read more….
Due to the conflict between Ukraine and Russia, energy prices soared last year. Energy prices are again rising this year. The energy sector will likely benefit from production cuts and surging demand. Therefore, it could be wise to buy fundamentally sound energy stocks MPLX LP (MPLX), Gibson Energy Inc. (GBNXF), and CONSOL Energy Inc. (CEIX).
Below I have discussed several reasons why buying these stocks could be a step in the right direction.
The global energy demand has rebounded faster than expected from the pandemic lows amid tight supplies. This and strained oil and gas supplies are pushing prices higher.
The national average price of gasoline has been rising as oil prices touched their highest level this year. According to AAA, the national average for a gallon of regular unleaded gasoline is up from $3.45 a month ago to $3.61 on April 30, 2023.
The rise in oil and gas prices could be attributed to the cut in oil production by the OPEC+ nations. The OPEC+ countries collectively cut 1.66 million barrels of output per day.
Post the production cuts announced by OPEC+, Goldman Sachs has raised its Brent Crude forecast to $95 from $90 by the end of the year. The bank also expects Brent crude to climb to $100 by the end of 2024, up from $97 projected earlier.
According to the International Energy Agency (IEA), world oil demand will climb by 2 mb/d (million barrels per day) in 2023 to a record 101.90 mb/d, driven by a ‘resurgent’ China, which is expected to account for 90% of growth in oil demand. Oil prices will also likely get a boost from American refineries undergoing spring maintenance and the transition to summer gas production, which constricts supply.
For the week to April 21, 2023, crude inventories declined by 5.1 million barrels to 460.9 million barrels, exceeding analysts’ expectations of a fall of 1.5 million barrels. Gasoline inventory decreased by 2.4 million barrels to 221.1 million barrels, falling higher than expectations of 900,000 barrels.
Product supply of gasoline, which is a proxy for demand, rose nearly 1 million barrels per day last week to 9.5 million bpd, its highest since December 2021.
Therefore, it could be wise to invest in energy stocks MPLX, GBNXF, and CEIX to capitalize on the rising energy demand.
MPLX LP (MPLX)
MPLX owns and operates midstream energy infrastructure and logistics assets. It operates in two segments: Logistics and Storage, and Gathering and Processing. The company is involved in the gathering, processing, and transporting natural gas; gathering; transportation, fractionation, exchange, storage, and marketing of natural gas liquids; gathering, storage, transportation, and distribution of crude oil and refined products.
MPLX is expected to pay shareholders a quarterly dividend of $0.775 per share on May 15, 2023. Its annual dividend of $3.10 yields 8.86% on the current share price. The company’s dividend payouts have increased at a 3.2% CAGR over the past three years and a 5.2% CAGR over the past five years. Its four-year average yield is 11.3%.
In terms of forward EV/EBITDA, MPLX’s 7.72x is 42.5% lower than the 13.43x industry average. Its 12.50x forward EV/EBIT is 26% lower than the 16.89x industry average. Likewise, its 12.69x forward non-GAAP P/E is 37.4% lower than the 20.27x industry average.
MPLX’s total revenues and other income for the fiscal year ended December 31, 2022, increased 15.8% year-over-year to $11.61 billion. Its net income attributable to MPLX LP rose 28.2% over the prior-year period to $3.94 billion. The company’s adjusted EBITDA increased 3.9% year-over-year to $5.78 billion. In addition, its EPS came in at $3.75, representing an increase of 31.1% year-over-year.
Analysts expect MPLX’s EPS for the quarter ended March 31, 2023, to increase 6.8% year-over-year to $0.83. Its revenue for fiscal 2024 is expected to increase 2.8% year-over-year to $10.78 billion. It surpassed Street EPS estimates in three of the trailing four quarters. Over the past nine months, the stock has gained 7.6% to close the last trading session at $34.99.
MPLX’s POWR Ratings reflect this positive outlook. MPLX has an overall rating of B, which translates to a Buy in our proprietary rating system. The POWR ratings assess stocks by 118 different factors, each with its own weighting.
It is ranked #11 out of 31 stocks in the A-rated MLPs – Oil & Gas industry. It has a B grade for Momentum, Stability, and Quality. Click here to see the other ratings of MPLX for Growth, Value, and Sentiment.
Gibson Energy Inc. (GBNXF)
Headquartered in Calgary, Canada, GBNXF is engaged in gathering, storing, optimizing, processing, and marketing liquids and refined products in North America. It operates through two segments, Infrastructure and Marketing.
GBNXF paid shareholders a quarterly dividend of $0.39 per share on April 17, 2023. Its annual dividend of $1.12 yields 6.81% on the current share price. The company’s dividend payouts have increased at a 4% CAGR over the past three years and a 1.6% CAGR over the past five years. Its four-year average yield is 6%.
In terms of forward EV/Sales, GBNXF’s 0.49x is 73.7% lower than the 1.87x industry average. Likewise, its 0.33x forward Price/Sales is 73.4% lower than the 1.24x industry average.
For the fiscal year ended December 31, 2022, GBNXF’s revenue increased 53% year-over-year to C$11.04 billion ($8.12 billion). Its gross profit rose 32.2% over the prior-year period to C$394.44 million ($290.06 million). The company’s net income increased 53.9% year-over-year to C$223.25 million ($164.17 million). Also, its EPS came in at C$1.50, representing an increase of 54.6% year-over-year.
Over the past month, the stock has gained 5.5% to close the last trading session at $16.91.
GBNXF’s POWR Ratings reflect solid prospects. It has an overall rating of B, which translates to Buy in our proprietary rating system.
Within the B-rated Energy – Services industry, it is ranked #12 out of 44 stocks. It has a B grade for Momentum and Stability. To see the other ratings of GBNXF for Growth, Value, Stability, Sentiment, and Quality, click here.
CONSOL Energy Inc. (CEIX)
CEIX produces and exports bituminous coal. It operates through Pennsylvania Mining Complex and CONSOL Marine Terminal segment. The company’s Pennsylvania Mining Complex segment mines, prepares, and markets bituminous coal to power generators and industrial end-users. Its CONSOL Marine Terminal segment provides coal export terminal services through the Port of Baltimore.
CEIX paid shareholders a cash dividend of $1.10 per share on February 28, 2023. Its annual dividend of $2.15 yields 7.41% on the current share price. Its four-year average yield is 0.58%.
In terms of forward EV/EBITDA, CEIX’s 1.89x is 62.7% lower than the 5.07x industry average. Its 2.37x forward EV/EBIT is 71.5% lower than the 8.31x industry average. Likewise, its 2.75x forward non-GAAP P/E is 68% lower than the 8.57x industry average.
CEIX’s total revenue and other income for the fourth quarter ended December 31, 2022, increased 32.6% year-over-year to $637.15 million. Its net income increased 64.5% year-over-year to $193.02 million. Its EPS came in at $5.39, representing an increase of 63.3% year-over-year. Also, its adjusted EBITDA increased 99.3% year-over-year to $240.28 million.
Analysts expect CEIX’s EPS and revenue for the quarter ended March 31, 2023, to increase 225.8% and 65.3% year-over-year to $5.04 and $592.75 million, respectively. It surpassed consensus EPS estimates in three of the trailing four quarters. Over the past year, CEIX has gained 24.7% to close the last trading session at $59.34.
CEIX’s strong fundamentals are reflected in its POWR Ratings. It has an overall rating of B, which equates to a Buy in our proprietary rating system.
It has an A grade for Quality and a B for Growth and Sentiment. It is ranked first out of 11 stocks in the A-rated Coal industry. Click here to see the other ratings of CEIX for Value, Momentum, and Stability.
What To Do Next?
Get your hands on this special report with 3 low priced companies with tremendous upside potential even in today’s volatile markets:
3 Stocks to DOUBLE This Year >
MPLX shares were trading at $35.06 per share on Monday morning, up $0.07 (+0.20%). Year-to-date, MPLX has gained 9.19%, versus a 9.27% rise in the benchmark S&P 500 index during the same period.
About the Author: Dipanjan Banchur

Since he was in grade school, Dipanjan was interested in the stock market. This led to him obtaining a master’s degree in Finance and Accounting. Currently, as an investment analyst and financial journalist, Dipanjan has a strong interest in reading and analyzing emerging trends in financial markets.
The post Sector Investors: This Industry Is the Best Bet in 2023 and 3 Stocks Pointing You in the Right Direction appeared first on StockNews.com
[ad_2]
Source link