Stocks have been pressing lower of late as the bond rates continue to rise. This had the S&P 500 (SPY) dangerously close to the 200 day moving average. Yet hidden in the Friday Government Employment report was a clue that sparked a rally and maybe puts an end to recent market weakness. Read on below for full details….
Right now the most important thing on investor’s minds is the dramatic rise in bond rates, and how that makes stocks less attractive. I tackled that subject pretty thoroughly in my previous commentary this week. Be sure it read now if you haven’t already:
When is the Stock Bouncing Coming?
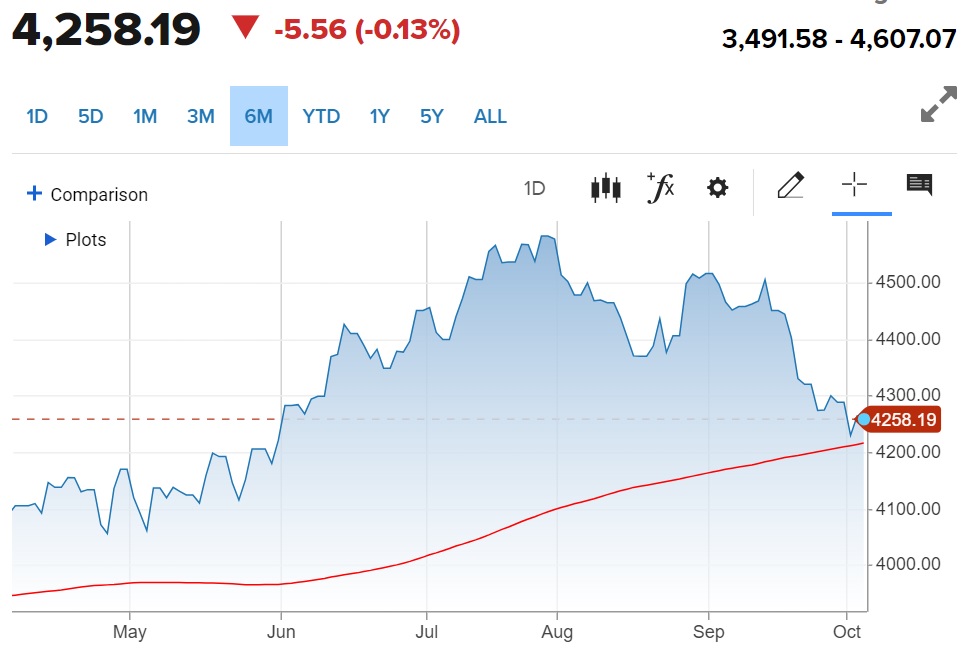
The quick answer to the above question, is that the bounce could be forming now as stock flirt with the 200 day moving average at 4,206 for the S&P 500 (SPY). That is the red line in the chart below.
On the fundamental front, if rates keep ripping higher, then it will only put more pressure on stock prices. I sense that 5% is a logical top for 10 year rates…but who says that the market is logical?
Also note on the fundamental end of things that the economic reports continue to come in positive. Even 20 months into the most aggressive Fed rate hiking regime in history, GDP estimates continue to be robust.
GDP Now has it their Q3 estimate all the way up to +4.9% bolstered by the most recent ISM Manufacturing report. Further, the Blue Chip Economist panel sees +2.9% as the more logical growth trajectory.
If I were to place a bet in Vegas I would say the Economists are much closer to the final number. Regardless, it is hard to look at these results and see a recession coming…and therefore it is hard to be truly bearish.
On top of that the Government Employment Situation report came out Friday morning much hotter than expected. Since so much of the initial market reaction is based on just reading the headline…then yes stocks sold off early in the session.
Gladly, as prudent investors dug into the details they discovered a hidden gem in the report. That being month over month wage inflation down to only 0.2% which means we are ebbing ever closer to the 2% inflation target for the Fed as this “sticky” form of inflation becomes unstuck at such high levels.
As this new spread…so too did the stock gains. As I put this commentary to rest with 90 minutes left in the Friday session we have a +1.4% result for the S&P 500 and nicely above recently resistance at 4,300.
Back to the big picture conversation about higher rates….
Yes, stock prices are down of late as “rates normalize” to more traditional historic levels. Meaning we are no longer enjoying the artificially low rates we that have been in hand the past 15 years.
Once everyone makes this adjustment to the new world view of rates…and realize the world is not falling apart…they will be compelled to put their money into the best stocks. And maybe Friday’s rally is an early sign of that taking place.
So, which are those best stocks, you ask?
Read on below for the answer…
What To Do Next?
Discover my brand new “2024 Stock Market Outlook” covering:
- Bear Case vs. Bull Case
- Trading Plan to Outperform
- What Industries Are Hot…Which Are Not?
- Top 11 Picks for the Year Ahead
- And Much More!
Gain access to this vital presentation now by clicking below:
Wishing you a world of investment success!

Steve Reitmeister…but everyone calls me Reity (pronounced “Righty”)
CEO, StockNews.com and Editor, Reitmeister Total Return
SPY shares were trading at $430.05 per share on Friday afternoon, up $5.55 (+1.31%). Year-to-date, SPY has gained 13.70%, versus a % rise in the benchmark S&P 500 index during the same period.
About the Author: Steve Reitmeister

Steve is better known to the StockNews audience as “Reity”. Not only is he the CEO of the firm, but he also shares his 40 years of investment experience in the Reitmeister Total Return portfolio. Learn more about Reity’s background, along with links to his most recent articles and stock picks.
The post Investor Alert: Hidden Gem for Stocks Found in Friday Report appeared first on StockNews.com
[ad_2]
Source link
After a brutal 2022, the stock market is showing signs of recovery this year, and investor sentiment continues to improve amid the constant moderation in inflation, recent robust economic data, and easing fears about the global financial system. As the stock market rebounds, fundamentally strong stocks M/I Homes, China Automotive (CAAS), and Bassett Furniture (BSET), riding high on sentiment, could be wise investments. Continue reading….
2022 was a rough year for the stock market and the economy. However, signs of cooling inflation, a less hawkish Fed, recent strong economic data, and easing bank system fears have put the stock market on a recovery path this year, with a few quality stocks leading the way.
As the stock market recovers, investor sentiment turns positive for M/I Homes, Inc. (MHO), China Automotive Systems, Inc. (CAAS), and Bassett Furniture Industries, Incorporated (BSET). These stocks could be ideal investments for significant returns.
2022 was a painful year for the stock market, and all three major market indices suffered their worst losses since 2008, with the benchmark S&P 500 declining more than 19%, while the Nasdaq and the Dow tumbled 33.1% and 8.8%, respectively. Multi-decade high inflation, monetary policy tightening, geopolitical concerns, and volatile economic data weighed on investor sentiment throughout the year.
While a volatile equity market environment persists this year, stocks have recovered some of the ground lost earlier. The S&P 500 gained nearly 5.6% year-to-date, while the Nasdaq Composite is up 13.3%.
Over time, inflation numbers have improved significantly. The Labor Department reported that the Consumer Price Index (CPI) increased 5% year-over-year in March, down from 6% in February and a peak of 9.1% last June. Moreover, annual inflation has dropped for the ninth consecutive month.
With the constant moderation in inflation, the Federal Reserve downshifted to smaller interest-rate increases. In late March, the Fed raised rates by 25 basis points (bps), taking the federal funds rate to a 4.75%-5% range. The decision was haunted by turmoil in the banking sector, which is potentially related to a higher interest rate environment.
To keep inflation on a sustained downward path to 2%, the central bank will likely increase interest rates by 25 bps at the May meeting, with a possible pause in view as lending slows.
Despite aggressive efforts from the Fed to cool off the economy, employees still have plenty of demand for workers. Payrolls rose by 236,000 in March, and the unemployment rate dropped to 3.5%. The economy added 472,000 jobs in January and 326,000 in February. While there are signs of a gradually cooling hiring trend, the labor market is still strong.
Furthermore, business activity climbed this month to nearly a 12-month high, boosted by stronger services and manufacturing. The S&P Global’s flash April composite purchasing managers index rose 1.2 points to 53.5, exceeding the expectations of economists surveyed by Bloomberg.
Recently, market sentiment is also improved by easing bank system fears. The failure of Silicon Valley Bank and other regional banks last month sparked worries about a financial crisis that could potentially harm the economy; however, the threat appears to be fading as governments stepped in to help stem withdrawals and offer stability to banking systems.
As the stock market appears to recover, it could be an excellent time to invest in quality stocks MHO, CAAS, and BSET for potential gains.
Let’s discuss the fundamentals of these stocks in detail:
M/I Homes, Inc. (MHO)
MHO operates as a builder of single-family homes in Ohio, Indiana, Illinois, Minnesota, Michigan, Texas, North Carolina, and Tennessee. The company operates through three segments: Northern Homebuilding; Southern Homebuilding; and Financial Services. In addition, it designs, constructs, and sells single-family homes and attached townhomes to first-time, move-up, and luxury buyers.
On January 25, MHO commenced operations in the Fort Myers/Naples, Florida market and announced that Kevin Brown had been named Area President. The company’s existing operations in Orlando, Tampa, and Sarasota, Florida, have been successful for many years. And opening in Fort Myers/Naples would allow MHO to build upon that success as it expands along the Southwest coast of Florida.
In terms of forward non-GAAP P/E, MHO’s 5.76x is 57.6% lower than the 13.57x industry average. Also, the stock’s forward EV/EBIT multiple of 5.14 is 59.2% lower than the industry average of 12.60.
MHO’s total revenue increased 16.2% year-over-year to $1 billion in the first quarter that ended March 31, 2023. Its gross margin rose 10.1% from the year-ago value to $234.63 million. The company’s operating income was $134.59 million, up 9.5% year-over-year. Also, its adjusted EBITDA grew 8.7% from the prior-year period to $146.82 million.
In addition, the company’s net income increased 12.2% from the year-ago value to $193.07 million, and its earnings per share were $3.64, an increase of 15.2% year-over-year.
Analysts expect MHO’s revenue to increase 6.3% year-over-year to $3.67 billion for the fiscal year ending December 2024. The company’s EPS for the same period is expected to rise 10.1% from the previous year to $12.24. Moreover, MHO has an impressive earnings surprise history as it surpassed the consensus EPS estimates in all four trailing quarters.
The stock has gained 49.5% over the past six months and 43.2% over the past year to close the last trading session at $64.01. It is currently trading above its 50-day and 200-day moving averages of $60.30 and $49.26, respectively.
MHO’s promising fundamentals are apparent in its POWR Ratings. The stock has an overall rating of A, equating to a Strong Buy in our proprietary rating system. The POWR Ratings are calculated by considering 118 different factors, each weighted to an optimal degree.
MHO has an A grade for Value, Sentiment, and Momentum. It topped among 24 stocks in the B-rated Homebuilders industry.
Click here to access the other ratings of MHO for Growth, Quality, and Stability.
China Automotive Systems, Inc. (CAAS)
Headquartered in Jingzhou, the People’s Republic of China, CAAS manufactures and sells automotive systems and components. It produces rack and pinion power steering gears for cars and light-duty vehicles; integral power steering gears for heavy-duty vehicles; power steering parts for light-duty vehicles; and sensor modules, among other systems and parts.
On December 12, 2022, CAAS introduced a new series of Electric Power Steering (EPS) systems for BYD Company Limited (BYDDF), China’s largest EV producer. After 18 months of preparation and close collaboration between both R&D teams, CAAS won design contracts for C-EPS, DP-EPS, and R-EPS from BYDDF for all its series of products.
Moreover, on November 29, CAAS announced a strategic partnership with BYDDF for future autonomous driving. CAAS’ Chairman, Mr. Hanlin Chen, said, “Together with our leadership in electric power steering systems, electric motors, and electric control software, we provide a total solution to empower leading OEMs like BYD to introduce state-of-the-art experiences to the marketplace.”
In terms of forward non-GAAP P/E, CAAS’ 9.06x is 33.2% lower than the 13.57x industry average. Likewise, its forward EV/EBITDA of 1.37x is 85.3% lower than the 9.29x industry average.
For the fiscal year that ended December 31, 2022, CAAS’ net product sales increased 6.3% year-over-year to $529.55 million, and its gross profit grew 15.7% year-over-year to $83.39 million. Also, the company’s operating income came in at $7.95 million, an increase of 44.1% year-over-year.
In addition, net income attributable to CAAS’ common shareholders was $21.18 million and $0.69 per share, up 91.7% and 91.7%, respectively.
The consensus revenue estimate of $593.11 million for the fiscal year 2024 reflects a 4.7% year-over-year growth. The consensus EPS estimate of $0.64 for the next year indicates a 33.3% increase from the previous year. In addition, CAAS has topped its consensus revenue estimates in three of the trailing four quarters.
Shares of CAAS have gained 5.3% over the past six months and 58.8% over the past year to close the last trading session at $4.35.
CAAS’ strong outlook is reflected in its POWR Ratings. The stock has an overall rating of A, which translates to a Strong Buy in our proprietary rating system.
CAAS has an A grade for Value and Sentiment. The stock has a B grade for Growth, Momentum, and Quality. It is ranked first among 46 stocks in the China industry. You can access all CAAS ratings here.
Bassett Furniture Industries, Incorporated (BSET)
BSET manufactures, markets, and retails home furnishings in the United States and internationally. It operates in two segments: Wholesale and Retail. In addition, the company provides warehousing services to customers in the furniture industry; and owns and leases retail store properties. It operates a network of more than 92 company-and licensee-owned stores.
In terms of forward non-GAAP P/E, BSET is currently trading at 11.93x, 12.1% lower than the industry average of 13.57x. Likewise, the stock’s forward EV/Sales and Price/Sales multiples of 0.28 and 0.29 are 65.3% and 64.9% lower than the industry averages of 1.10 and 0.83, respectively.
BSET’s retail sales of furniture and accessories increased 1.3% year-over-year to $107.70 million in the first quarter that ended February 25, 2023. Cash inflows from operating activities were $563,000. As of February 25, 2023, the company’s current assets and total assets stood at $183.75 million and $391.62 million, respectively.
Analysts expect BSET’s revenue and EPS for the fiscal year (ending November 2024) to increase 3.4% and 60.9% year-over-year to $450.53 million and $1.92, respectively. Over the past five days, the stock has plunged 5% to close the last trading session at $14.20.
BSET’s POWR Ratings reflect its promising outlook. The stock has an overall rating of A, which equates to a Strong Buy in our proprietary rating system.
The stock has an A grade for Sentiment and a B for Value and Quality. Within the 59-stock Home Improvement & Goods industry, it is ranked #2.
Beyond what we stated above, we also have BSET’s ratings for Growth, Stability, and Momentum. Get all BSET ratings here.
The Bear Market is NOT Over…
That is why you need to discover this timely presentation with a trading plan and top picks from 40 year investment veteran Steve Reitmeister:
REVISED: 2023 Stock Market Outlook >
MHO shares were unchanged in premarket trading Thursday. Year-to-date, MHO has gained 38.61%, versus a 6.14% rise in the benchmark S&P 500 index during the same period.
About the Author: Mangeet Kaur Bouns

Mangeet’s keen interest in the stock market led her to become an investment researcher and financial journalist. Using her fundamental approach to analyzing stocks, Mangeet’s looks to help retail investors understand the underlying factors before making investment decisions.
The post Investor Sentiment Turns Positive With These 3 Stocks as the Stock Market Rebounds appeared first on StockNews.com
[ad_2]
Source link
The upcoming earnings season could be highly volatile in the face of uncertain macroeconomic conditions, including high inflation, rising interest rates, recent bank failures, and growing recessionary risks. Amid this backdrop, it could be wise to avoid fundamentally weak stocks TuSimple Holdings (TSP), Ra Medical (RMED), and Agrify (AGFY), which are going to release their earnings reports tomorrow. Continue reading….
The Fed’s continued rate hikes and the recent turmoil in the financial system have increased the likelihood of a recession this year. Amid an uncertain macro environment, analysts expect a stormy earnings reporting season. We think that investors should avoid struggling stocks TuSimple Holdings Inc. (TSP), Ra Medical Systems, Inc (RMED), and Agrify Corporation (AGFY), which are expected to release their earnings reports this Wednesday.
The Federal Reserve raised interest rates by a quarter-point, balancing the fight against stubborn inflation with the recent turmoil in the banking sector. The Fed’s move marked the ninth-rate hike and lifted the federal fund rates to a range of 4.75%-5%. Fed officials feel that “some additional policy firming” may be needed and expect the year-end 2023 policy rate at 5.1%.
Investors await the jobs report due this Friday to see whether the labor market softened under the pressure of increasing layoffs last month. According to data from Trading Economics, the economy is expected to add 238,000 jobs in March, and the unemployment rate is set to hold steady at 3.6%.
High inflation, steady interest rate hikes, and growing risks of tighter credit conditions amid several bank failures raise the probability of an economic downturn this year.
Veteran economist David Rosenberg warned that corporate profits are declining. A slump in corporate profits could be a sign of an oncoming economic downturn and weigh on the stock market. “If 2022 was about multiple contraction from nosebleed levels, 2023 is when interest rates percolate through the economy and into corporate earnings,” he said.
Amid a challenging macro environment, it could be potentially volatile this earnings season. TSP, RMED, and AGFY are slated to release earnings reports tomorrow, and in this piece, I have discussed various reasons why investors should avoid these stocks.
TuSimple Holdings Inc. (TSP)
TSP designs autonomous technology specifically designed for semi-trucks in the United States and internationally. The company operates its Autonomous Freight Network (AFN) L4 autonomous semi-trucks equipped with its autonomous driving technology.
On December 22, 2022, TSP announced a restructuring plan which would impact approximately 350 employees or 25% of its workforce. The company plans to actively work with key shipping partners to operationalize its autonomous technology. And to help ensure capital efficiency, it also plans to scale back freight expansion.
Cheng Lu, TSP’s President and CEO said, “I returned to TuSimple as CEO to help address a number of challenges and set the Company up for long-term success. This required evaluating our entire workforce and making tough decisions. It’s no secret that the current economic environment is difficult. We must be prudent with our capital and operate as efficiently as possible.”
TSP’s trailing-12-month gross profit margin of negative 98.16% compares to the industry average of 29.29%. Likewise, its trailing-12-month ROCE, ROTC, and ROTA of negative 36.24%, 20.44%, and 38.06% compare to the respective industry averages of 13.67%, 6.96%, and 5.16%.
During the third quarter that ended September 30, 2022, TSP’s gross loss widened 63.5% year-over-year to $2.78 million. Its loss from operations worsened by 3.2% from the year-ago value to $119.66 million. Its adjusted EBITDA loss was $93.60 million for the quarter. Also, the company reported a net loss and net loss per share attributable to common shareholders of $113.16 million and $0.50, respectively.
Furthermore, as of September 2022, the company’s cash and cash equivalents were $871.36 million, compared to $1.34 billion as of December 31, 2021. Its total liabilities stood at $111.50 million, compared to $69.35 million as of December 31, 2021.
Analysts expect TSP’s loss per share to widen 12.9% year-over-year to $0.60 for the fourth quarter that ended December 2022. Also, the company’s loss per share for fiscal 2023 is expected to worsen by 16.7% from the previous year to $2.36.
Over the past year, shares of TSP have declined 89% to close the last trading session at $1.40. Also, the stock has plunged 82.4% over the past six months.
TSP’s POWR Ratings reflect this weak outlook. It has an overall rating of F, equating to a Strong Sell in our proprietary rating system. The POWR Ratings are calculated by considering 118 different factors, with each factor weighted to an optimal degree.
The stock has an F grade for Quality and a D for Sentiment, Value, and Stability. It is ranked #19 out of 20 stocks in the D-rated Trucking Freight industry. Click here to see additional ratings of TSP (Momentum and Growth).
Ra Medical Systems, Inc (RMED)
RMED is a medical device company. It owns an advanced excimer laser-based platform for treating vascular immune-mediated inflammatory diseases. The company also develops electrophysiology products to provide patients, physicians, and hospitals with technologies to improve patients’ lives with cardiac arrhythmias.
RMED’s trailing-12-month ROCE, ROCE, and ROTA of negative 158.51%, 74.55%, and 154.50% compare to the industry averages of negative 40.21%, 21.80%, and 31.63%, respectively. In addition, the stock’s trailing-12-month asset turnover ratio is 99.8% lower than the 0.35x industry average.
For the third quarter that ended September 30, 2022, RMED reported an operating loss of $4.78 million. Its loss from continuing operations came in at $4.76 million. The company’s net loss widened 10.8% year-over-year to $4.76 million, while its net loss per share was $4.36 for the third quarter.
In addition, as of September 30, 2022, its cash and cash equivalents were $13.66 million, compared to $15.05 million as of December 31, 2022.
The consensus revenue estimate of $14,000 for the fiscal year 2022 indicates a 36.4% decline year-over-year. Moreover, RMED missed the consensus EPS estimates in three of the trailing four quarters, which is disappointing. The stock has declined 36.1% over the past month and 76.5% over the past six months to close the last trading session at $1.56.
RMED’s weak fundamentals are reflected in its POWR Ratings. The stock has an overall D rating, equating to Sell in our proprietary rating system.
RMED has an F grade for Stability and Quality. It also has a D for Value and Momentum. The stock is ranked #133 out of 140 stocks in the D-rated Medical-Devices & Equipment industry.
In addition to the POWR Ratings grades I’ve just highlighted, you can see the RMED’s ratings for Sentiment and Growth here.
Agrify Corporation (AGFY)
AGFY develops precision hardware and software cultivation and extraction solutions for the cannabis and hemp industry. It provides vertical farming units and Agrify Insights Software-as-a-Service software; integrated grow racks and LED grow lights; and non-proprietary products manufactured by third parties, including air cleaning systems and pesticide-free surface protection products.
On November 9, 2022, AGFY adjusted its fiscal year 2022 outlook as industry-wide challenges and a tough macro environment continue to challenge the business. Also, the pending lawsuit from Bud & Mary’s, which resulted in an unanticipated deferral of nearly $5.30 million in third-quarter revenue, is expected to impact fourth-quarter revenue.
The company expects to generate total revenue between $65 million and $70 million for the full-year 2022 instead of the prior guidance range of $70 million to $75 million.
AGFY’s trailing-12-month gross profit margin of 9.39% is 67.9% lower than the industry average of 29.29%. Also, the stock’s trailing-12-month EBITDA and net income margins of 82% and 208.4% are significantly lower than the industry averages of 9.72% and 6.49%, respectively.
AGFY’s revenues decreased 55.4% year-over-year to $7 million in the third quarter that ended September 30, 2022. Its gross loss for the third quarter totaled $4.10 million, compared to $380,000 in the prior-year period. Its operating expenses increased 191.5% from the year-ago value to $27.40 million. The company’s adjusted EBITDA loss was $28.80 million.
Additionally, the company’s net loss and net loss per share widened by 372.4% and 270.3% year-over-year to $46.30 million and $17.33, respectively. Cash flow used in operating activities was $8.50 million, compared to $3.70 million in the same quarter in 2021.
Analysts expect AGFY’s revenue to decline 56.2% year-over-year to $11.07 million for the fourth quarter that ended December 2022. The company is expected to report a loss per share of $1.31 for the same period. In addition, it failed to surpass the consensus EPS estimates in each of the trailing four quarters.
Furthermore, analysts expect AGFY to report a loss per share of $2.22 for the fiscal year 2024. The stock has slumped 58.2% over the past month and 99.6% over the past year to close the last trading session at $0.16.
AGFY’s bleak prospects are reflected in its POWR Ratings. The stock has an overall rating of D, translating to Sell in our proprietary rating system.
AGFY has an F grade for Stability and Sentiment and a D for Quality. Within the F-rated Biotech industry, the stock is ranked #332 of 401 stocks. To see additional POWR Ratings of AGFY for Growth, Value, and Momentum, click here.
What To Do Next?
Get your hands on this special report:
What gives these stocks the right stuff to become big winners, even in this brutal stock market?
First, because they are all low priced companies with the most upside potential in today’s volatile markets.
But even more important, is that they are all top Buy rated stocks according to our coveted POWR Ratings system and they excel in key areas of growth, sentiment and momentum.
Click below now to see these 3 exciting stocks which could double or more in the year ahead.
TSP shares were unchanged in premarket trading Tuesday. Year-to-date, TSP has declined -14.63%, versus a 8.19% rise in the benchmark S&P 500 index during the same period.
About the Author: Mangeet Kaur Bouns
Mangeet’s keen interest in the stock market led her to become an investment researcher and financial journalist. Using her fundamental approach to analyzing stocks, Mangeet’s looks to help retail investors understand the underlying factors before making investment decisions.
The post Earnings Roll Call! Stocks EVERY Investor Is Watching This Wednesday, and Why You Should Avoid Them appeared first on StockNews.com
[ad_2]
Source link